 ar
ar bg
bg hr
hr cs
cs da
da nl
nl fi
fi fr
fr de
de el
el hi
hi it
it ko
ko no
no pl
pl pt
pt ro
ro ru
ru es
es sv
sv tl
tl iw
iw id
id lv
lv lt
lt sr
sr sk
sk sl
sl uk
uk vi
vi et
et hu
hu th
th tr
tr fa
fa ms
ms hy
hy ka
ka ur
ur bn
bn mn
mn ta
ta kk
kk uz
uz ku
ku
resistance of temperature sensor
Kingmach resistance of temperature sensor covers the site-condition layer of structural and geotechnical monitoring. It records the environmental forces and operating conditions that often explain why a structural sensor changes. Rainfall can precede slope movement or seepage; soil wetness can show whether water has reached a sensitive layer; temperature can affect strain, expansion, and sensor behavior; humidity can reveal cabinet and tunnel risks; wind can explain vibration, pressure, and access constraints. A useful description of this category should therefore start with the monitoring problem. The equipment is not installed to fill a dashboard with weather values. It is installed so engineers can compare conditions with settlement, displacement, tilt, load, vibration, strain, inspection notes, and maintenance actions. When these records share time stamps and point names, the owner can see both the trigger and the response. That makes abnormal-event review faster and helps long-term reports distinguish seasonal patterns from real deterioration.
If the reading seems unusual, the team should check the physical condition of the station before drawing conclusions about the asset. Blockage, poor exposure, loose wiring, water entry, and changed surroundings can all create misleading patterns.
A practical report links the condition value with time, place, and action. It should help a reviewer decide whether to keep observing, inspect the field point, compare nearby instruments, or record the event as normal site behavior.


Application of resistance of temperature sensor
Geotechnical engineering uses Kingmach resistance of temperature sensor to explain how water and weather affect ground behavior. Soil wetness, rainfall, temperature, and humidity can influence slopes, embankments, foundation pits, tunnel portals, retaining walls, and reclamation areas. Environmental data should be reviewed with inclinometers, settlement sensors, displacement meters, pore-pressure records, and field inspections. A deformation curve during dry weather may suggest a different cause than a curve following repeated rainfall and rising soil wetness. Engineers also need to know whether construction work, loading, drainage changes, or excavation occurred during the same period. Environmental monitoring gives the missing condition layer, helping the team move from “the ground moved” to a more useful question: what changed around the ground before it moved?
If the reading seems unusual, the team should check the physical condition of the station before drawing conclusions about the asset. Blockage, poor exposure, loose wiring, water entry, and changed surroundings can all create misleading patterns.
A practical report links the condition value with time, place, and action. It should help a reviewer decide whether to keep observing, inspect the field point, compare nearby instruments, or record the event as normal site behavior.
For owners, the strongest record is the one that remains understandable after staff changes. Clear units, plain point names, installation photos, maintenance notes, and linked structural channels make the data usable beyond the original project team.
The future of resistance of temperature sensor
Water-driven geotechnical review will shape future Kingmach resistance of temperature sensor. Slopes, embankments, dams, and foundation pits often respond to rain and wetting in delayed ways. Future reports can compare rainfall timing, wetting depth, deformation rate, pore pressure, seepage, and inspection observations. This will help engineers see whether the ground only reacted briefly or remained active after the weather event. It will also support more targeted site visits because the team can identify which area had both environmental change and structural response. Environmental data will become part of geotechnical reasoning rather than a weather appendix.
If the reading seems unusual, the team should check the physical condition of the station before drawing conclusions about the asset. Blockage, poor exposure, loose wiring, water entry, and changed surroundings can all create misleading patterns.
A practical report links the condition value with time, place, and action. It should help a reviewer decide whether to keep observing, inspect the field point, compare nearby instruments, or record the event as normal site behavior.
Care & Maintenance of resistance of temperature sensor
Soil-condition maintenance for Kingmach resistance of temperature sensor should protect the contact between the buried point and the surrounding material. Air gaps, disturbed soil, cable damage, excavation, animal activity, or water paths along the cable can all affect readings. Installation records should include depth, soil type, location photo, cable route, and first stable value. During review, compare soil wetness with rainfall, irrigation, groundwater, and nearby deformation. If a buried channel becomes flat or jumps suddenly, inspect cable continuity and recent site work before treating it as a real soil change. Buried points are easy to forget, so their maintenance history must be visible in the project file.
If the reading seems unusual, the team should check the physical condition of the station before drawing conclusions about the asset. Blockage, poor exposure, loose wiring, water entry, and changed surroundings can all create misleading patterns.
A practical report links the condition value with time, place, and action. It should help a reviewer decide whether to keep observing, inspect the field point, compare nearby instruments, or record the event as normal site behavior.
Kingmach resistance of temperature sensor
The data chain behind Kingmach resistance of temperature sensor should be as clear as the sensors themselves. Environmental channels may use different signal types, units, update intervals, and power needs. If the channel names are weak, a report may confuse rainfall with another station, wind direction with wind speed, or room humidity with cabinet humidity. Each point should have a unit, location, data path, inspection interval, and linked structural record. This prevents environmental data from being collected but ignored. During an alarm, the team should be able to open one timeline and see the condition change, the structural response, and the maintenance note. That is where environmental monitoring becomes practical.
During abnormal events, the first question is not only whether the value crossed a limit. The reviewer should ask what changed around the site, whether the related structure reacted, and whether a field inspection confirmed the same pattern.
Long-term value comes from consistency. A channel that keeps the same location, unit, maintenance history, and linked asset record can support seasonal comparison, post-storm review, and handover between construction and operation teams.
FAQ
Q: How does rainfall data support slope review?
A: Rainfall gives the timing and intensity background for movement, seepage, wetting, and field inspections after storms.
Q: Why measure soil wetness as well as rainfall?
A: Rainfall stays at the surface record, while buried wetness shows whether water reached the soil depth that may influence movement.
Q: How does wind data support bridge or tower monitoring?
A: Wind direction and exposure can explain vibration, deflection, access difficulty, and weather-driven structural response.
Q: Why monitor humidity underground?
A: Humidity can affect cabinets, connectors, corrosion, sensor stability, and operating conditions in tunnels, subways, mines, and equipment spaces.
Q: How does temperature help interpretation?
A: Temperature helps reviewers separate thermal behavior from structural change in strain, displacement, cabinet condition, or material response.
Long-term value comes from consistency. A channel that keeps the same location, unit, maintenance history, and linked asset record can support seasonal comparison, post-storm review, and handover between construction and operation teams.
Reviews
Joshua Clark
We ordered a full monitoring solution including sensors and data loggers. Everything works seamlessly together. Great supplier!
Matthew Garcia
Instrumentation cables are durable and perform well even in harsh environments. Will definitely order again.
Latest Inquiries
To protect the privacy of our buyers, only public service email domains like Gmail, Yahoo, and MSN will be displayed. Additionally, only a limited portion of the inquiry content will be shown.
Amelia***@gmail.comSingapore
Hello, I am looking for visualization software for monitoring system data analysis. Please let me kn...
Evelyn***@gmail.comSouth Africa
Hi, we are a contractor working on tunnel construction and need settlement sensors and displacement ...
Related product categories
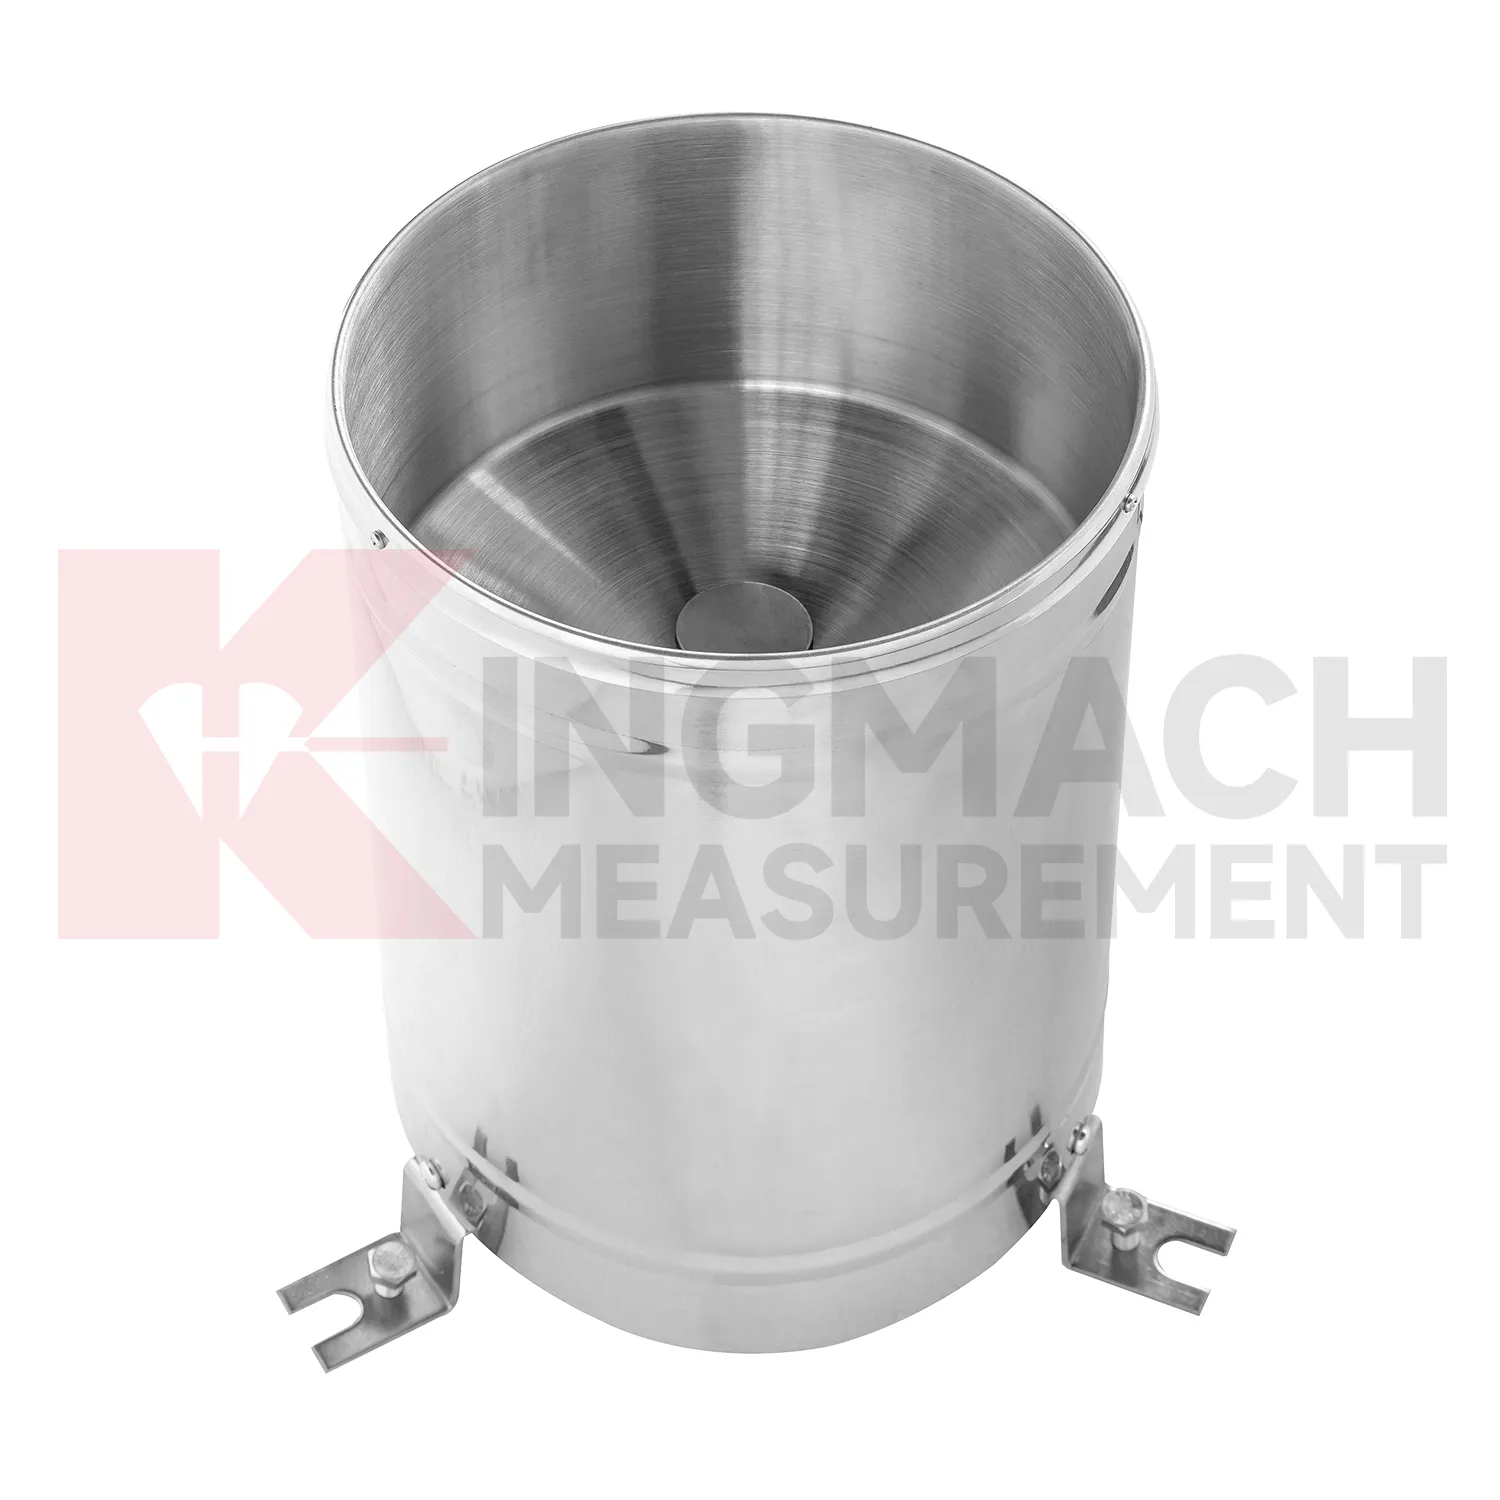
- tipping bucket rain gauge 0.2 mm resolution standard
- tipping bucket rain gauge data logger
- tipping bucket rain gauge resolution 0.1 mm typical
- tipping bucket rain gauge resolution 0.2 mm typical
- tipping bucket rain gauge typical resolution 0.2 mm standard
- typical tipping bucket rain gauge resolution 0.2 mm standard
- Temperature Sensor
- Chain-type Temperature Sensor
- Temperature String
- Daisy-Chained Digital Thermometer
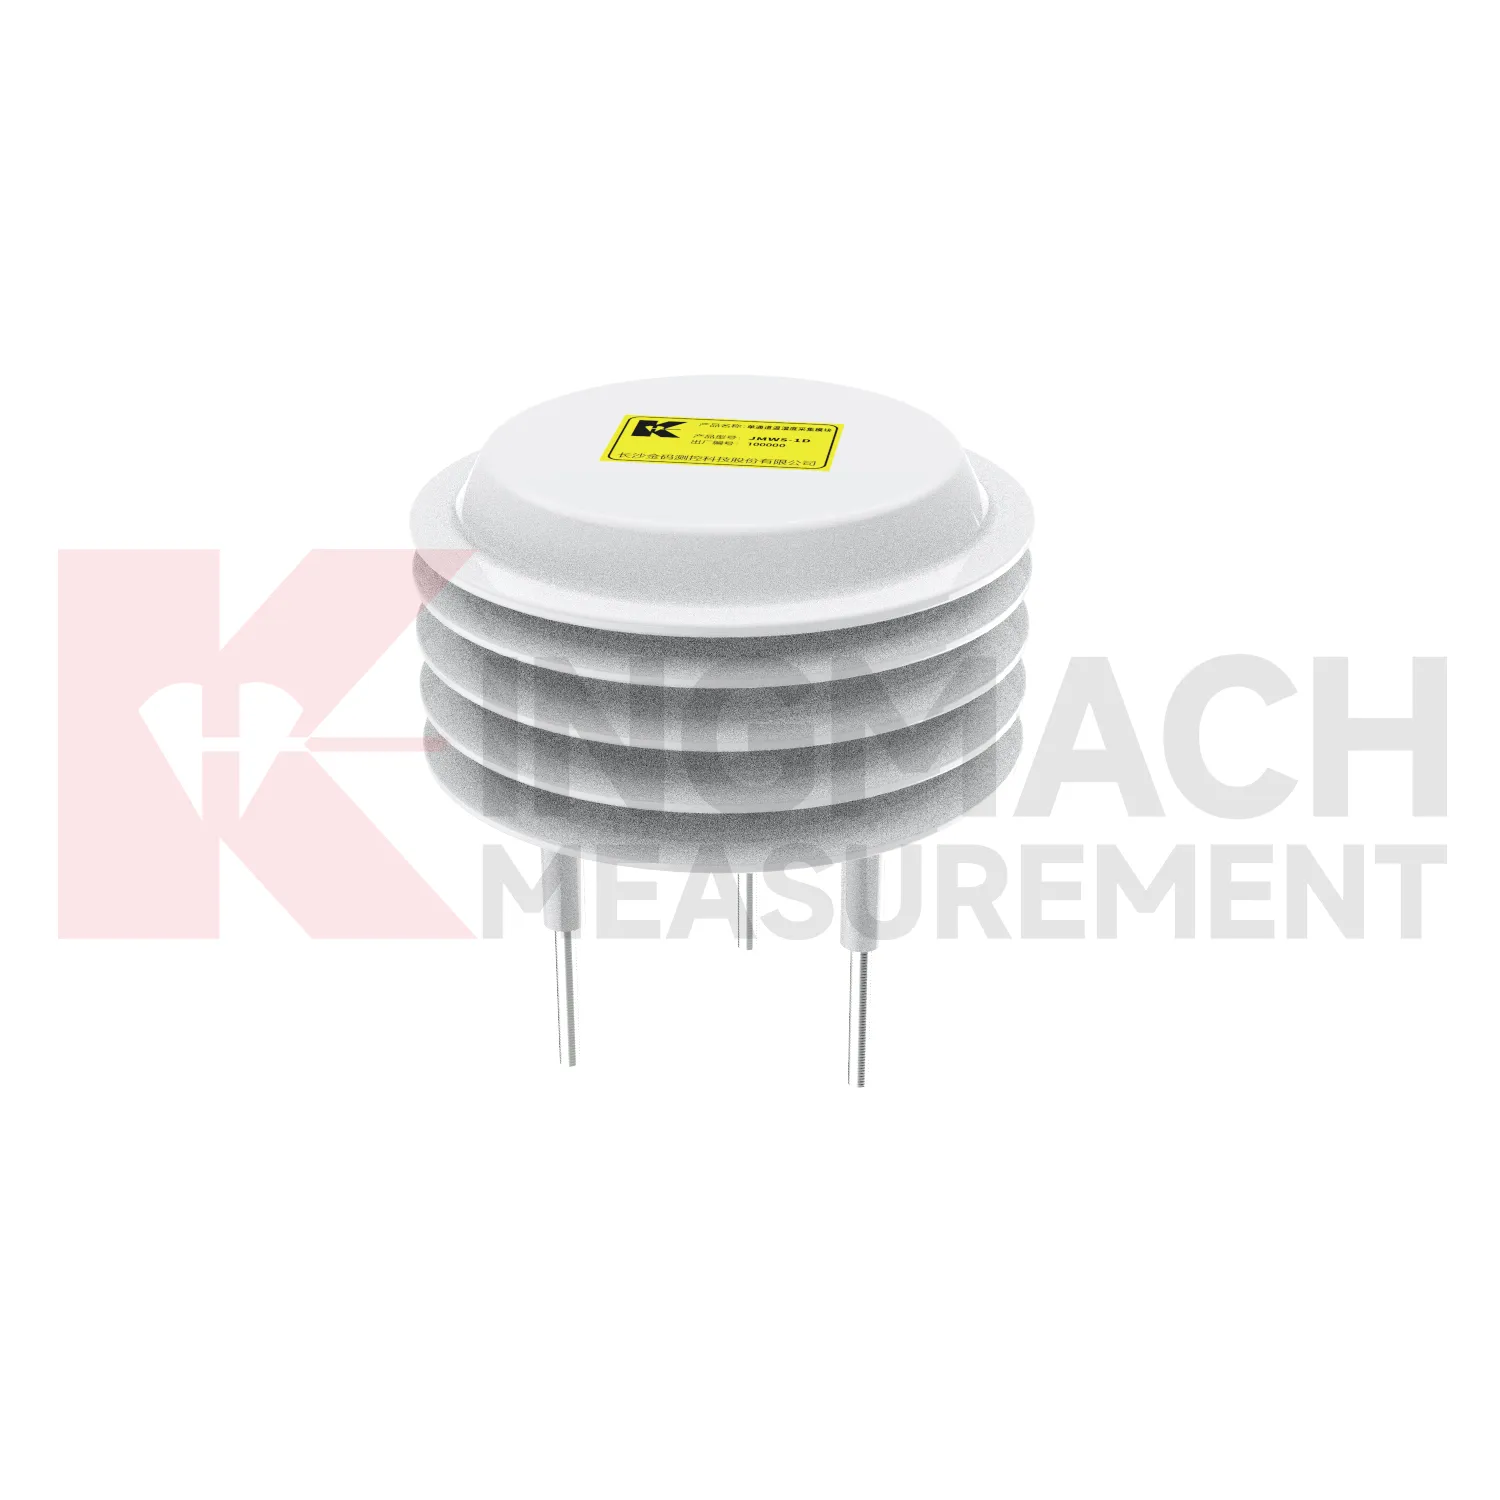
- Single-Channel Temperature and Humidity Acquisition Module
- Environmental Monitoring