 ar
ar bg
bg hr
hr cs
cs da
da nl
nl fi
fi fr
fr de
de el
el hi
hi it
it ko
ko no
no pl
pl pt
pt ro
ro ru
ru es
es sv
sv tl
tl iw
iw id
id lv
lv lt
lt sr
sr sk
sk sl
sl uk
uk vi
vi et
et hu
hu th
th tr
tr fa
fa ms
ms hy
hy ka
ka ur
ur bn
bn mn
mn ta
ta kk
kk uz
uz ku
ku
load cell wire diagram
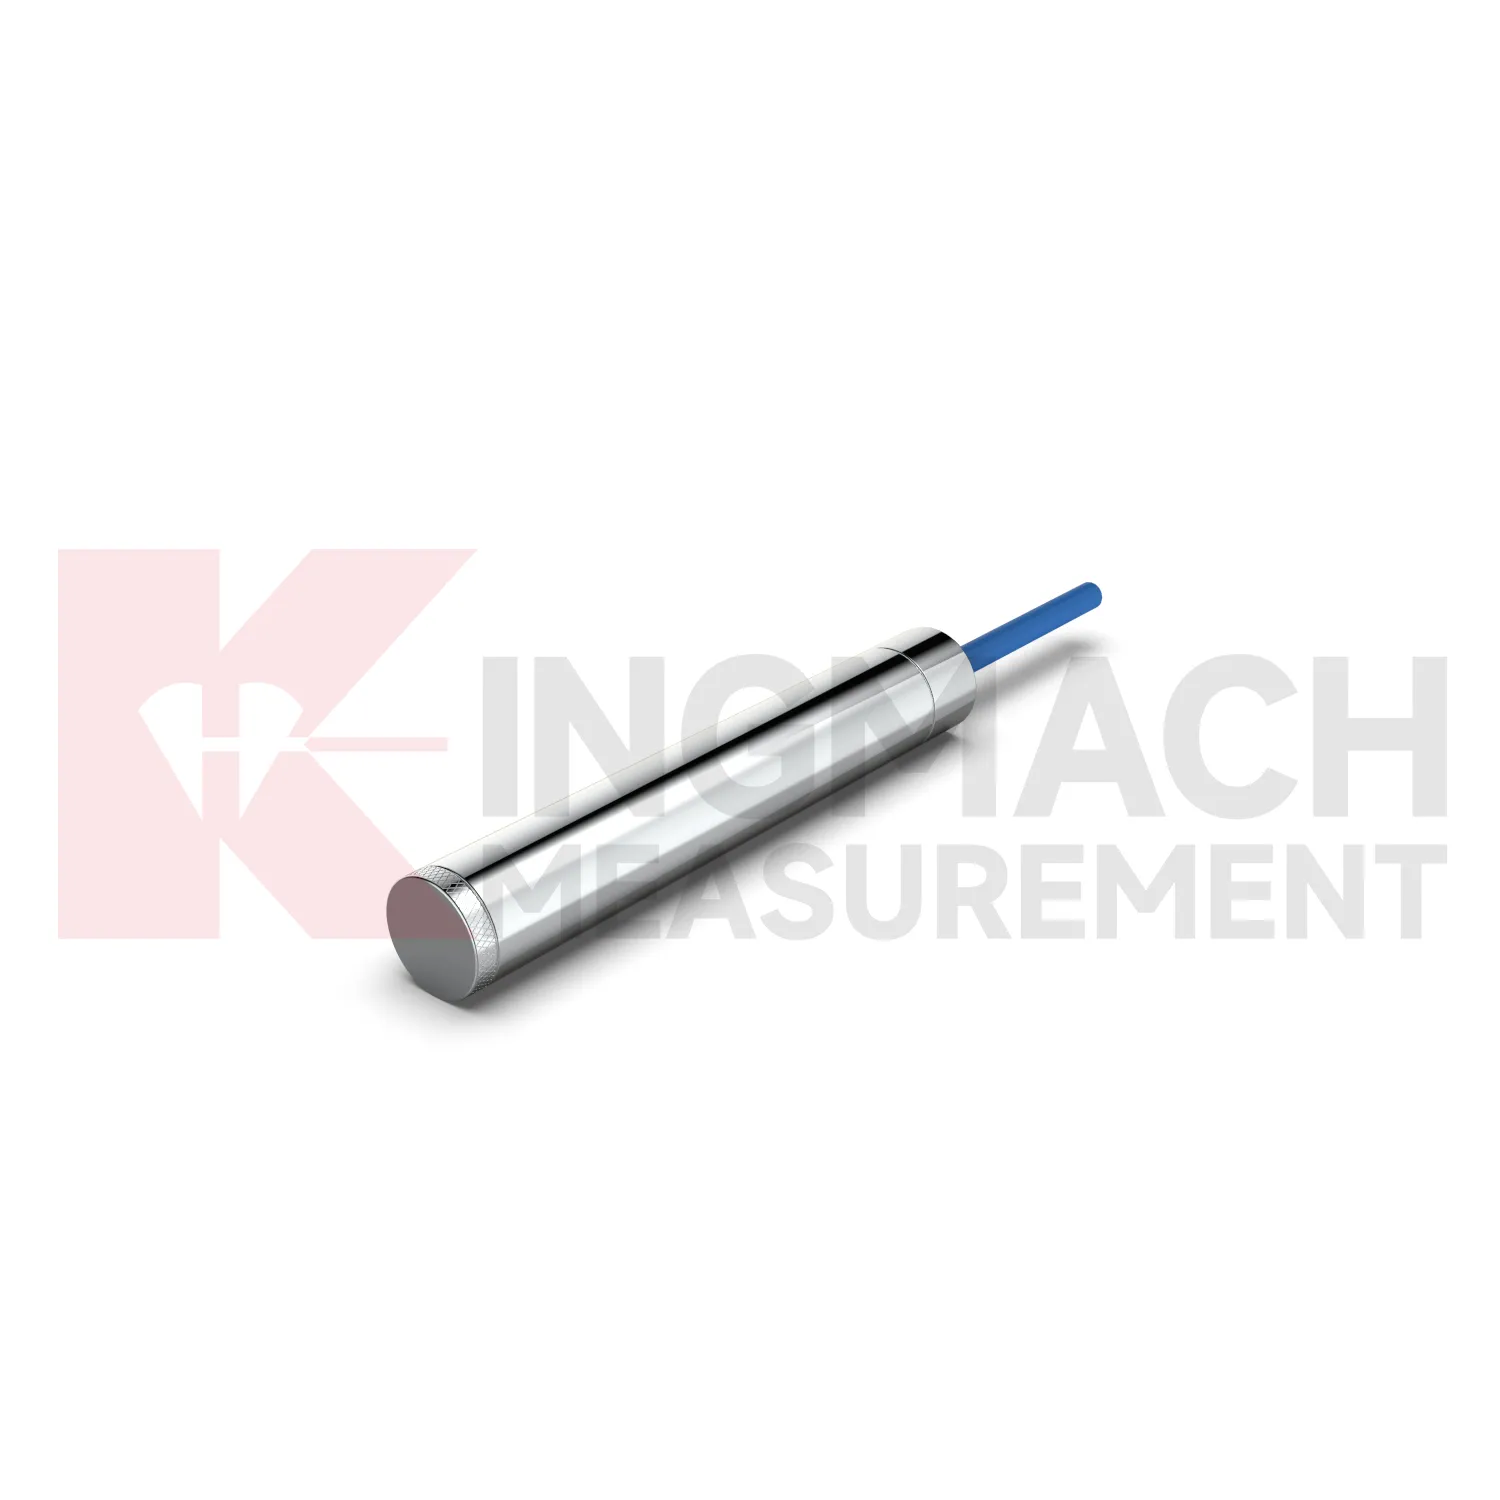
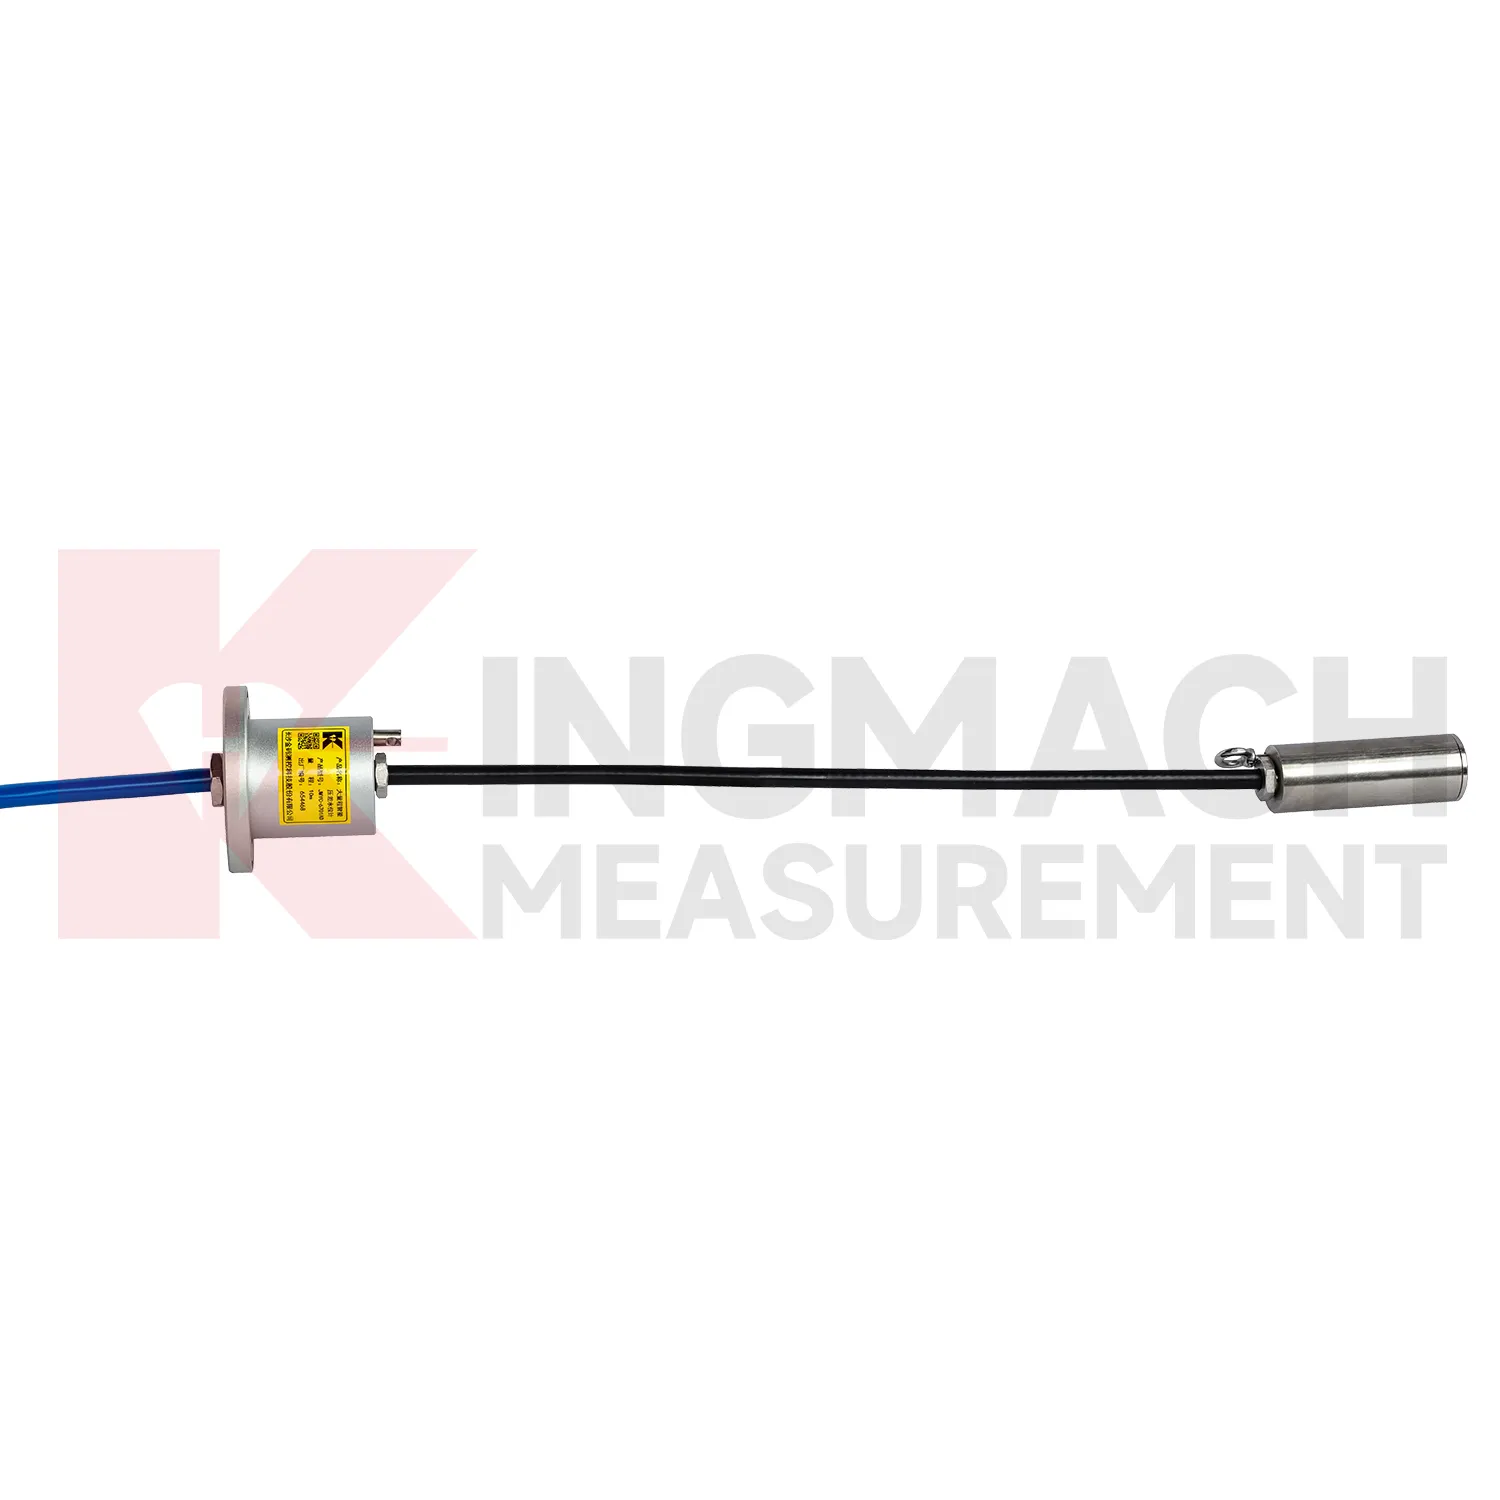
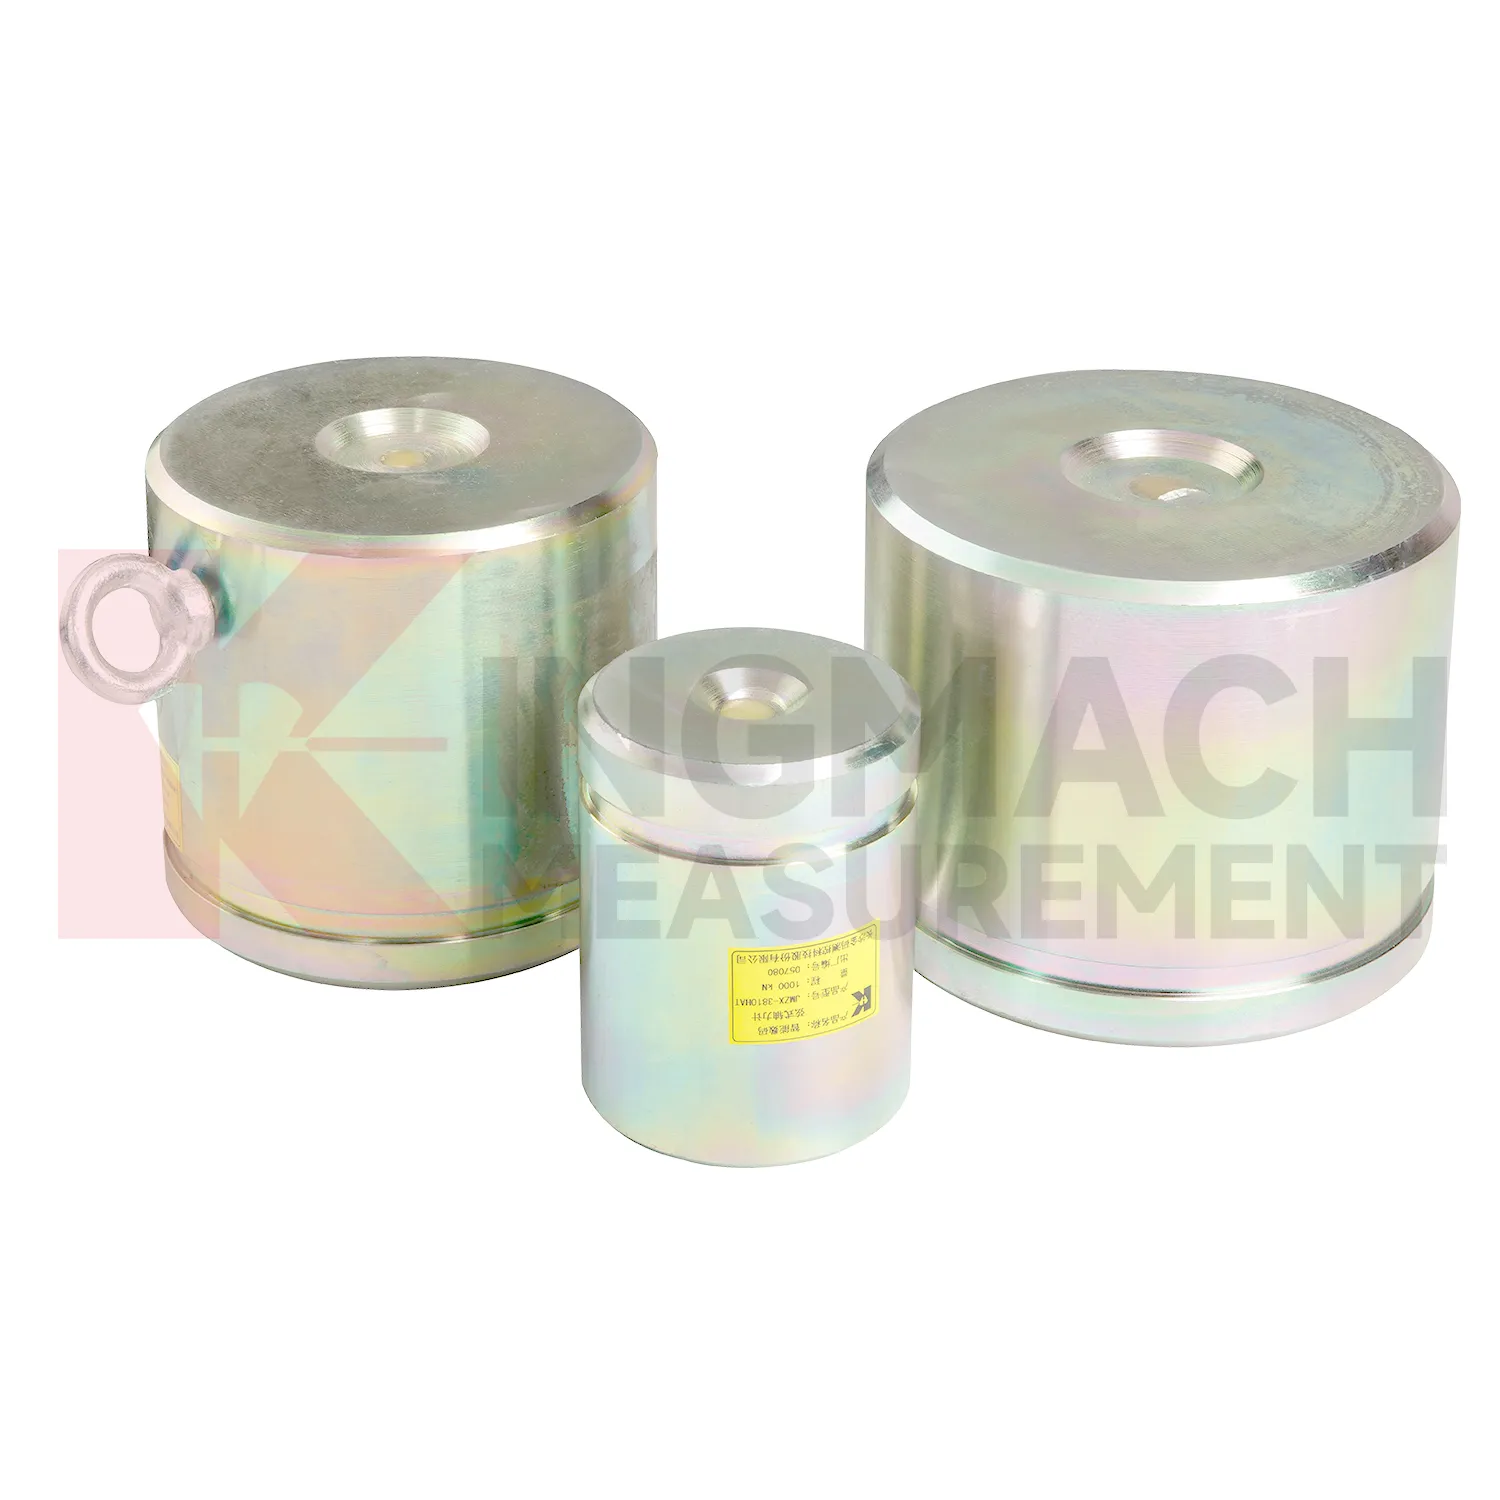
Kingmach load cell wire diagram for axial force monitoring addresses a common site problem: steel supports in deep foundation pits and tunnels can gain load quickly as excavation progresses. The JMZX-38XXHAT axial force load meter is listed in 200 kN, 500 kN, 1000 kN, 2000 kN, and 3000 kN ranges, with 0.1 kN or 1 kN sensitivity and 0.5%FS accuracy. Its product page lists a 1 MPa waterproof rating, automatic temperature correction, imported high strength steel wires, and direct axial force display in kN rather than only vibrating wire frequency. Claw type installation accessories are provided to help field placement. These features make the product relevant for temporary support monitoring, tunnels, tailings ponds, bridges, buildings, railways, transport, hydropower, and dams. Kingmach also notes that many axial force meters are customized, with model, range, and dimension confirmed at order. That matters when the support diameter, bearing plate thickness, and available clearance are already fixed by the construction design. The brand information also points to practical supply details, including Changsha origin, project use across transport and hydropower works, readout compatibility, and packaging for precision sensors. For engineering buyers, these details help connect catalog parameters with delivery, calibration, installation, and later service expectations.
Application of load cell wire diagram
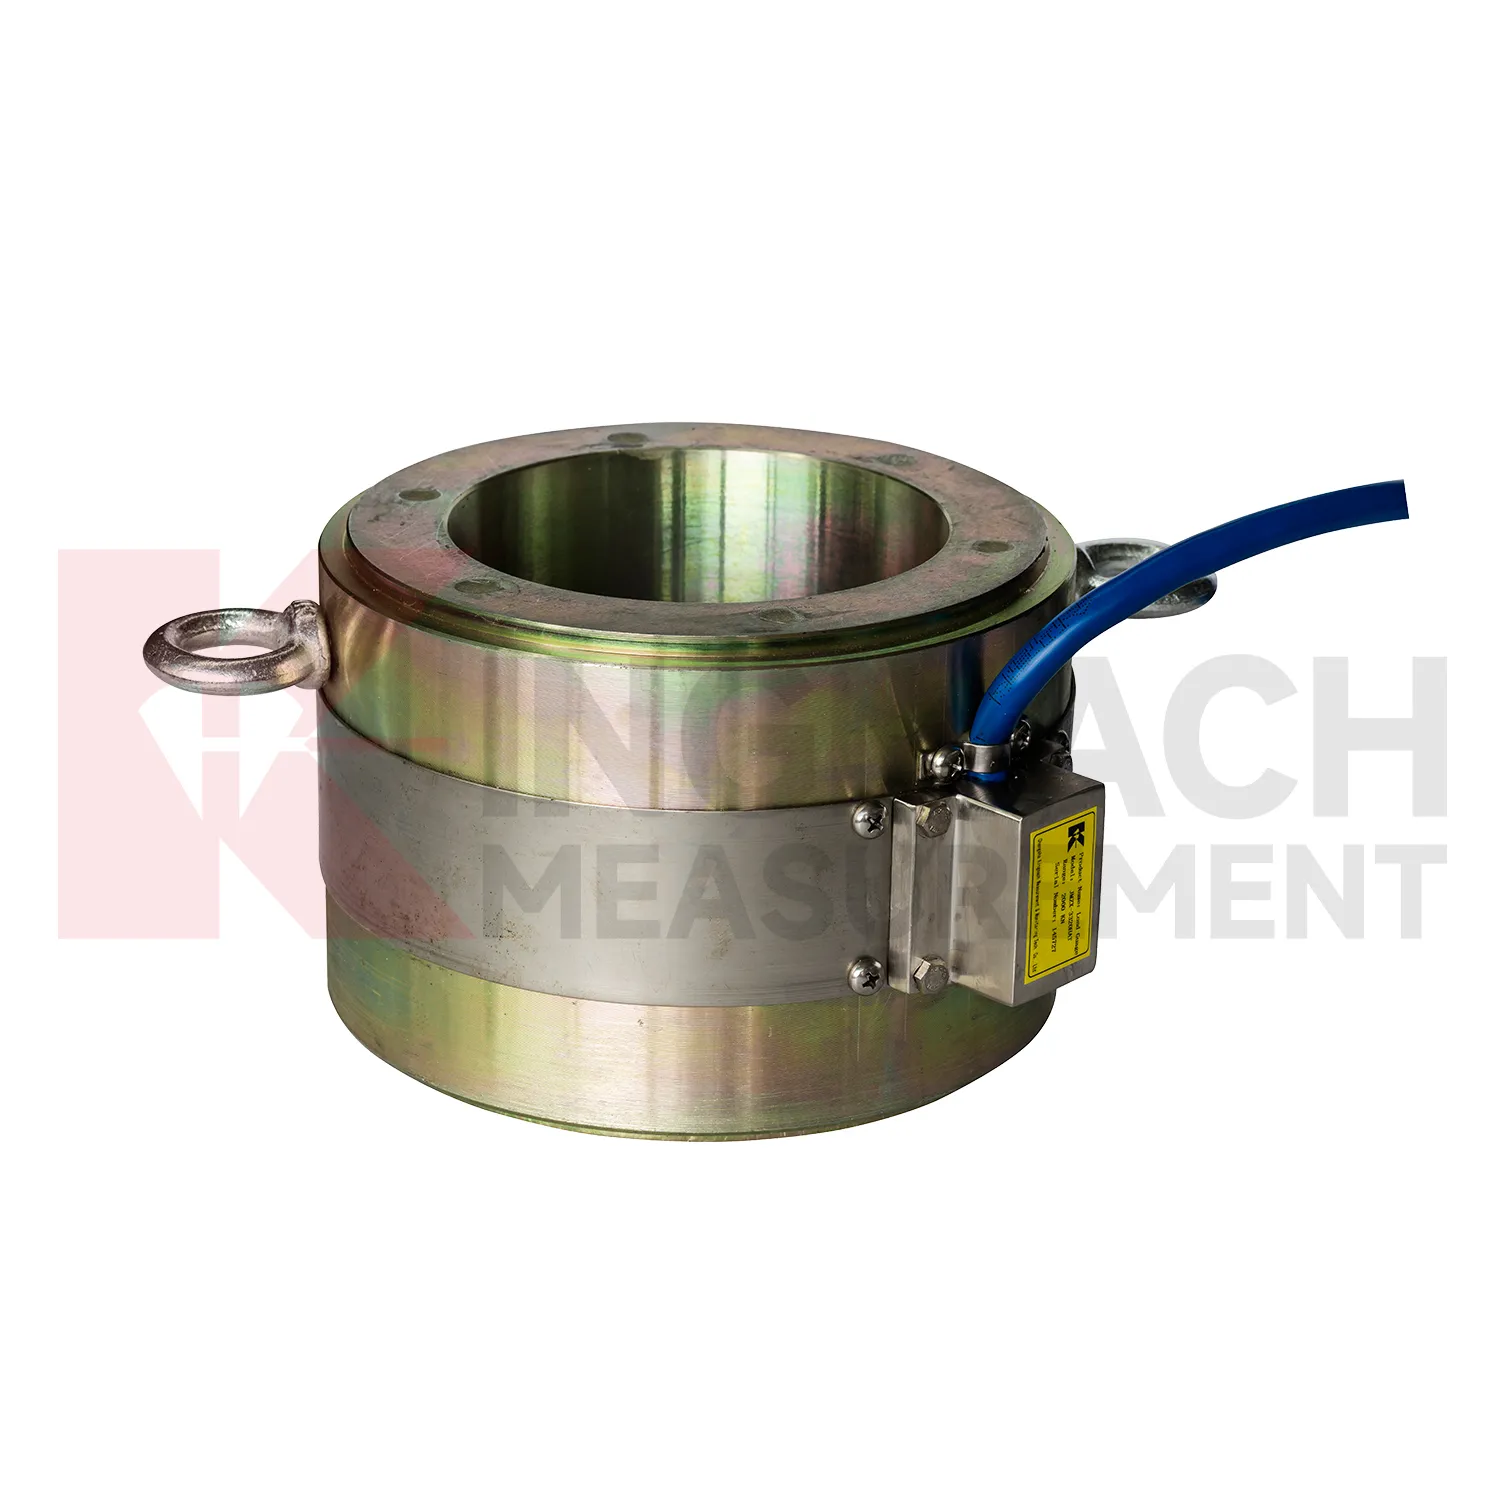
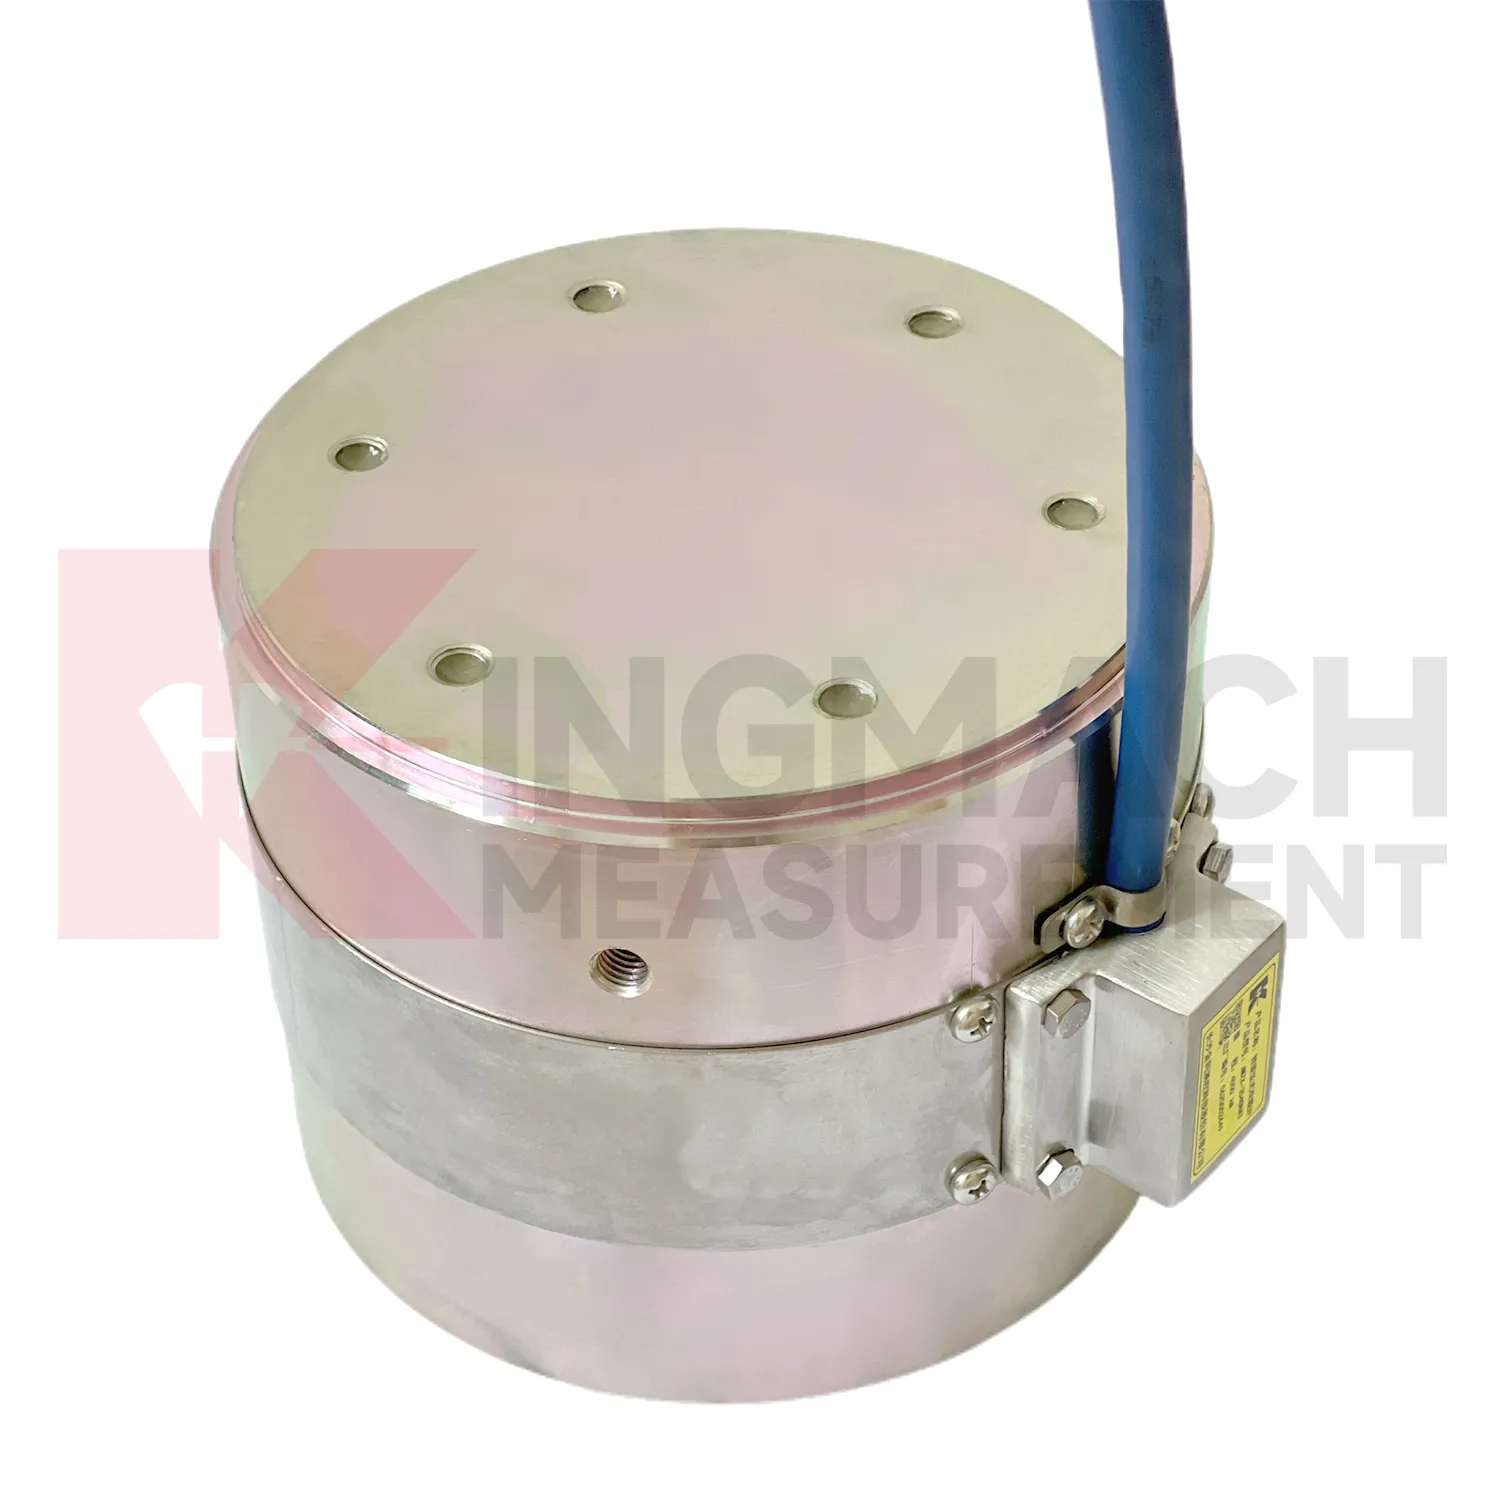
In foundation pit projects, load cell wire diagram supports strut force monitoring, anchor load control, retaining wall pressure checks, and load transfer review as soil is removed. The painful part of this work is timing: force can rise quickly after excavation, rainfall, dewatering, or support adjustment, while the working area is still changing every day. The axial force meter JMZX-38XXHAT covers 200 kN to 3000 kN and provides 0.5%FS accuracy with direct kN display. For soil pressure at retaining structures, the JMZX-50XXAT/ATM earth pressure cell line covers 0.3 MPa to 8 MPa with 0.001 MPa resolution and 0.5%FS pressure accuracy. These numbers give the monitoring team enough detail to track staged construction rather than only final condition. Good use also depends on bearing plates, adequate surface strength, cable protection, waterproof connectors, and a reading plan after each excavation layer. The force record should be compared with settlement, horizontal displacement, water pressure, and nearby construction notes. If automated monitoring is used, alarm thresholds should be tied to excavation stages rather than copied across all channels. A strut close to the active excavation face may behave differently from one several levels above, even when the same instrument model is used.
The future of load cell wire diagram
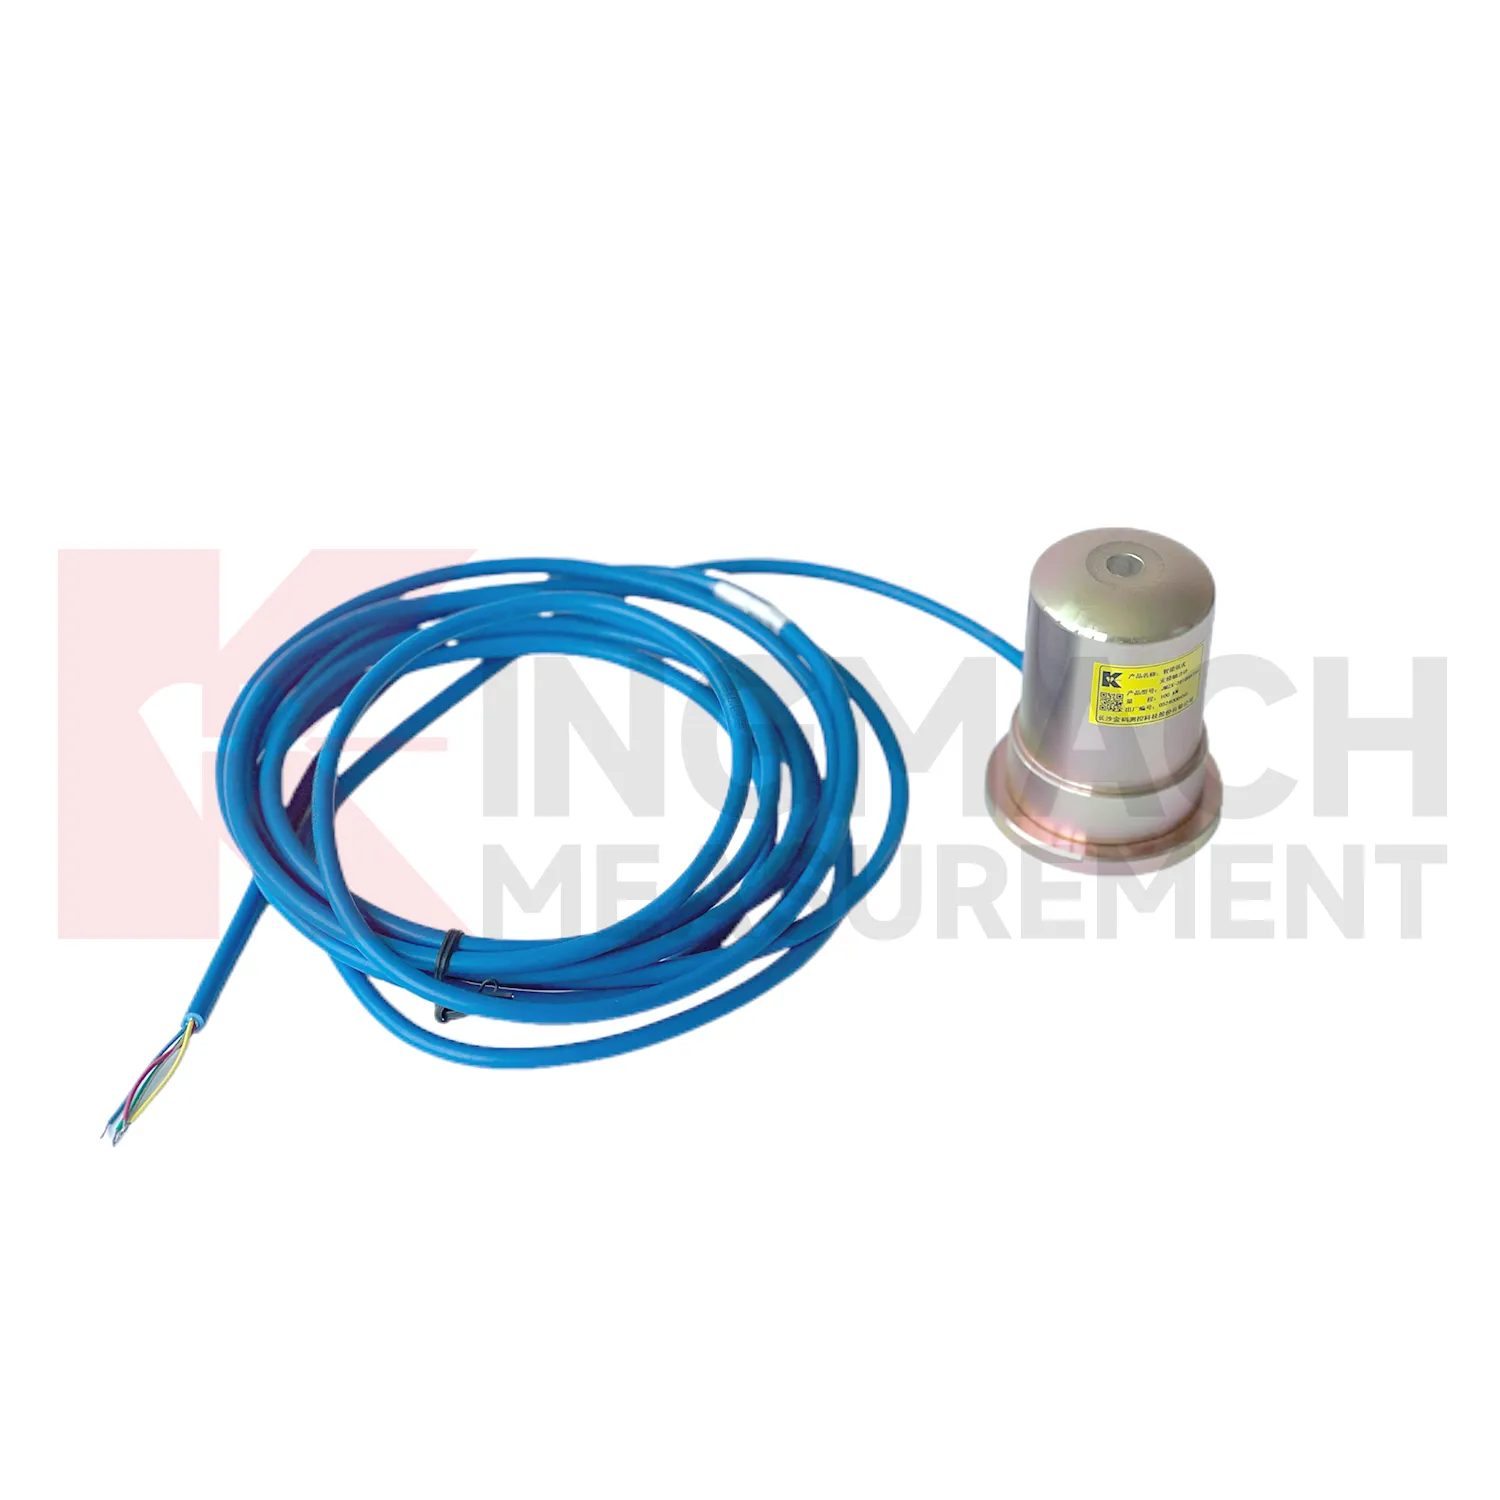
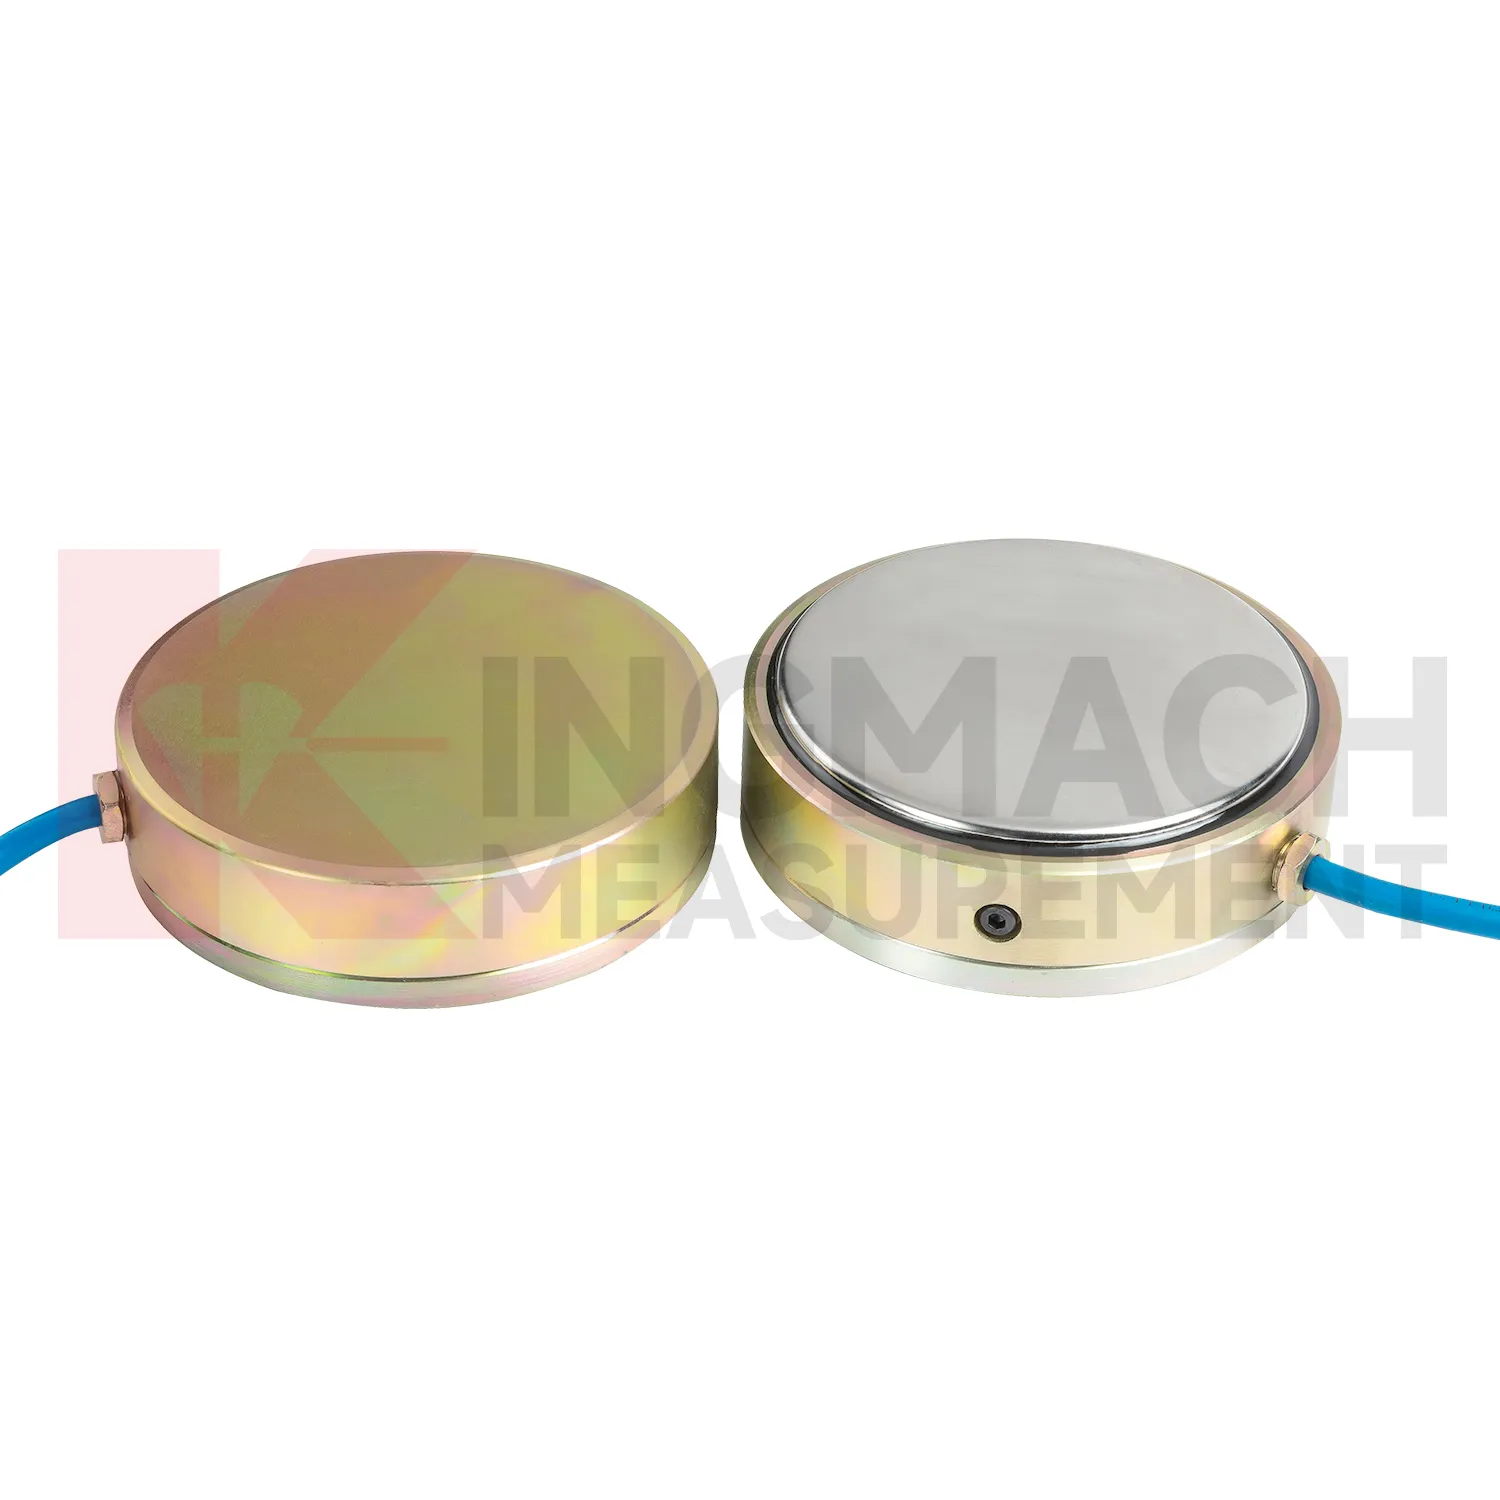
Industrial and test bench use of load cell wire diagram will likely move toward automated verification. High capacity solid load cells with 0.5%FS precision and ranges up to 10000 kN can already support heavy compression tests, jack calibration work, and equipment checks. Future systems can connect these instruments to local software that records test stages, operator notes, temperature, overload events, and calibration status. That reduces the risk of a handwritten record being separated from the force data. Edge acquisition can also prevent common errors by warning when the zero point is unstable, the load rate is outside procedure, or the sensor range is being approached too quickly. Kingmach's smart memory features fit this direction because the sensor can carry identity and calibration background. The strongest future workflow will combine rugged hardware, automatic records, and simple review tools, so a test can be repeated months later with the same measurement basis. The same logic applies to factory tests and site acceptance.
Care & Maintenance of load cell wire diagram
For load cell wire diagram used in pile load testing, care begins before the first load step. Confirm that the selected solid load cell range, often between 1000 kN and 10000 kN on Kingmach listed models, exceeds the planned test load with proper margin. Check the 0.1 kN resolution, 0.5%FS precision, calibration certificate, bearing plate flatness, and centering arrangement. During the test, protect the cable from jack movement and keep the readout position safe from vibration and water. Record zero value, temperature, load stage, hold time, unloading stage, and any pause or adjustment. After the test, inspect the sensor for dents, side load marks, connector damage, and cable jacket cuts. Store the calibration coefficient with the test report, not only with the instrument box. If later readings appear inconsistent, compare them with jack pressure, settlement data, and loading procedure before blaming the sensor. Store the report with the test file.
Kingmach load cell wire diagram
load cell wire diagram belongs at the point where a drawing stops being a guess and the structure begins to report what is really happening. In Kingmach engineering monitoring, force data is used around bridge cables, anchor heads, pier bearings, pile tests, retaining systems, and temporary steel supports. The reading is not only a number in kN. It is a record of where the force sits, when it changed, and which construction or service condition caused that change. A practical monitoring plan often pairs force with displacement, settlement, tilt, temperature, water pressure, or rainfall, because load rarely moves alone. For procurement teams, the useful questions are direct: capacity range, accuracy, installation space, cable route, waterproofing, calibration record, and data acquisition method. When these items are settled before site work starts, the same instrument can support acceptance checks, construction control, and later maintenance decisions without forcing engineers to rebuild the data story. That early planning also keeps later reports from mixing force trends with installation doubts.
FAQ
Q: How can load cell wire diagram be connected to a monitoring platform? A: Use compatible readouts, acquisition modules, data loggers, DTUs, and software platforms according to site access, cable distance, power, and reporting requirements. Q: What makes smart models useful in large networks? A: Stored model data, calibration coefficients, zero values, temperature data, and measurement records reduce confusion across many channels. Q: Should manual readings still be kept? A: Yes, manual checks are useful after installation, maintenance, abnormal alarms, or logger changes. Q: How should alarm limits be set? A: Base them on design stage, sensor range, expected load change, temperature behavior, and nearby monitoring points. Q: What data should be reviewed together with force? A: Settlement, displacement, tilt, water level, pore pressure, rainfall, temperature, construction events, and inspection notes.
Reviews
James Thompson
The tiltmeters and accelerometers are very sensitive and provide precise data. Perfect for our structural health monitoring system.
Joshua Clark
We ordered a full monitoring solution including sensors and data loggers. Everything works seamlessly together. Great supplier!
Latest Inquiries
To protect the privacy of our buyers, only public service email domains like Gmail, Yahoo, and MSN will be displayed. Additionally, only a limited portion of the inquiry content will be shown.
Mia***@gmail.comNetherlands
Dear team, we are interested in your readouts & data loggers compatible with multiple sensors. Do yo...
Emma***@gmail.comCanada
Dear Sir/Madam, we are interested in displacement transducers and settlement sensors for a geotechni...